Woocommerce custom reports provide crucial insight into the store’s revenue, stock performance. WooCommerce is a very popular addon for WordPress that converts a WordPress website into a functional eCommerce store. But it also comes with little complications in creating custom reports.
Woocommerce Reports
If you are an agency or eCommerce store owner, having a WooCommerce reporting dashboard will help you understand the performance of your eCommerce store. While WooCommerce does have an option to view the reports by going to the WooCommerce > Reports.
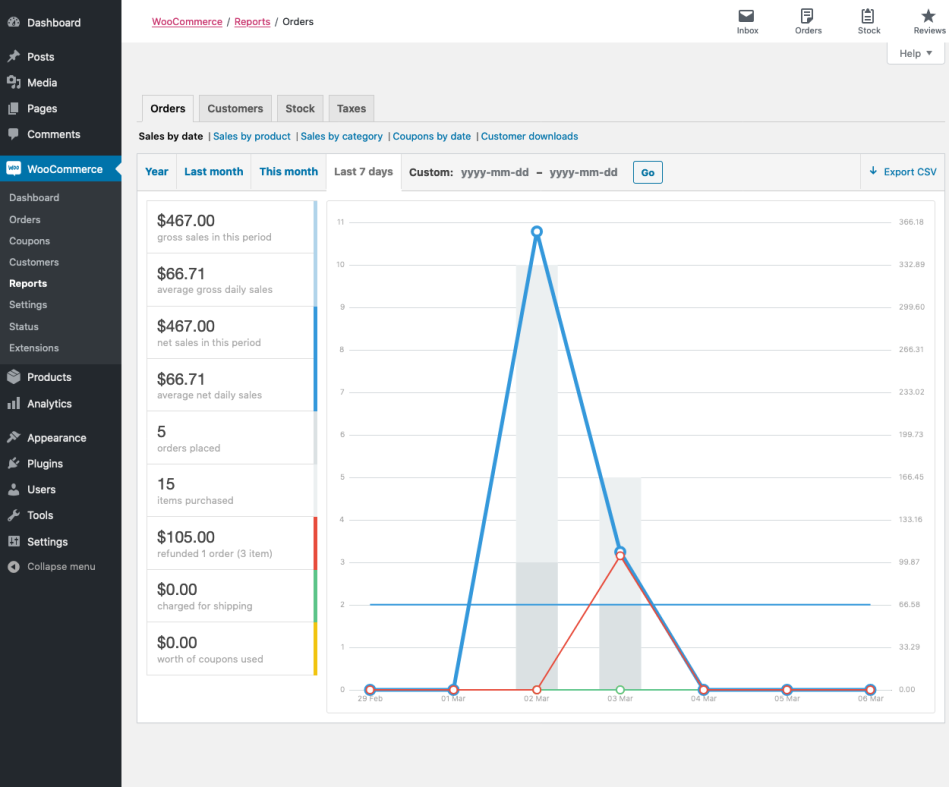
There are four tabs in the reporting section
Orders: This will allow you to view the revenue and volume of sales by product, category, coupon date and customer download.
Customers: This will allow you to view reports for customers vs guests.
Stock: This will help you analyze the stock of the products.
Tax: This will allow viewing the taxes by state.
The Orders, Customers and Tax tabs have the option to view the data by date, week, month and year. Woocommerce also allows you to export the report in .csv format where you can share it with your client or marketing team. But this reporting might not be enough for most of the users and clients.
And if you require a different or additional report, then it would require custom code or plugin to add that feature/functionality.
The major downside of the WooCommerce inbuilt reports is you could able to see it only if you have access to the backend. What if you want to share with your marketing team or agency about the performance? You probably need some real-time reporting dashboard. If you are feeling the same, continue reading the blog. We will see how to create a woo-commerce custom report to view your Key Performance Indicators.
Create WooCommerce custom Reports for Free
We will be using databox for creating a WooCommerce custom report. Databox is more similar and considered as an alternative to data studio.
Databox is a business analytics platform built to help you understand what’s going on with your business. It’s been ranked as the number 1 most usable data visualization tool by G2 Crowd.
With databox, you can create real-time reports and can be shared and accessed anywhere and on any device just with the internet. And the best part is it doesn’t require you to log in to your WooCommerce store backend all the time to view the performance.
Let’s see how to create a WooCommerce custom report using databox.
- Visit Databox and create a free account. The forever free account provides 3 data source connections with 4 dashboards which is more than sufficient to create a Facebook ads report.
- Choose the data source as “Woocommerce” and click to continue.
- You need to enter the API key and secret generated from your wocommerce store so that all the data could be populated in the databox.
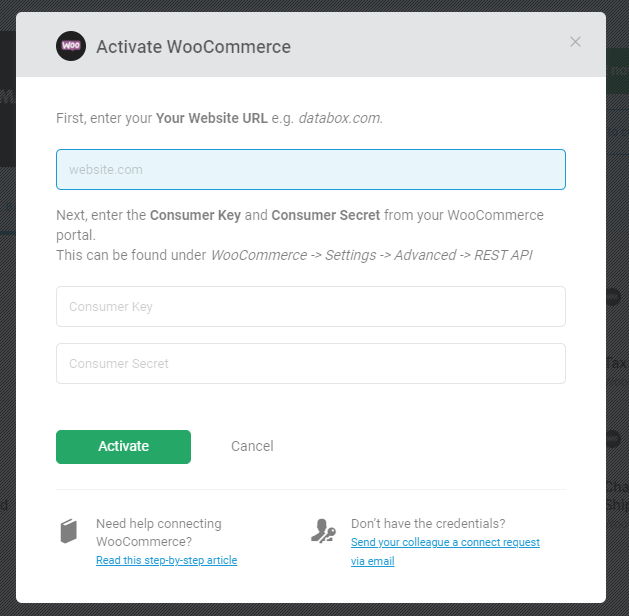
How to find your WooCommerce Consumer Key and Secret
a) Login into the WordPress Admin
b) In the left side panel, select Woocommerce > Settings Advanced Tab > REST API
c) Click Add Key and enter your Key details. Click Generate API Key
d) Once generated, copy the Consumer Key and Consumer Secret to the Databox Activation window
4. Choose the metrics that are important to you but anyway this will be shown separately in the platform and has nothing to do with your reporting. So you don’t even have to choose anything other than the default selection. Once then Click to continue.
5. Now click to edit and customize the dashboards as per your wish. And you can add up to three databoards in a free plan. So you can extend your report up to three databoards and loop them together.
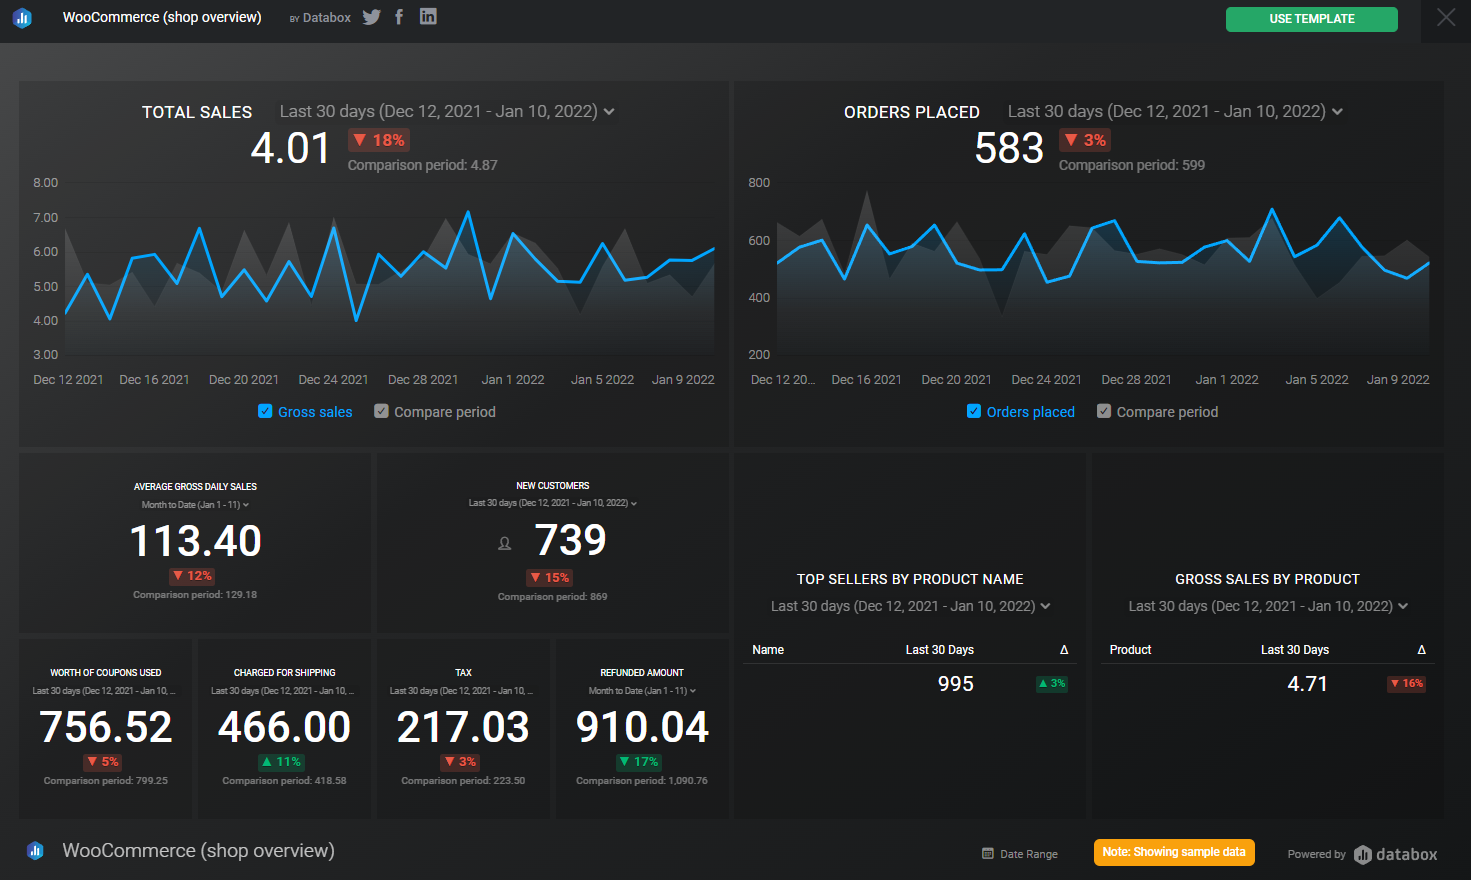
What are the metrics available in databox for WooCommerce?
- Total Sales
- Gross sales by product
- Average gross daily sales
- Net sales
- Average net daily sales
- Tax
- Orders placed
- Items purchased
- Refunded amount
- Refunded orders
- Refunded Items
- Charged for shipping
- Worths of coupons used
- Top sellers by product name
- New customers
- Average Items purchased per order
- Charged for shipping percentage
- Average order amount
The databox has other available integrations like Google Analytics, Google Ads, and Facebook which will help you to create comprehensive reports for your eCommerce store. See how to create a Facebook ads report.
Custom Woocommerce Reporting Templates
You can create a custom reporting template from the scratch or you can use any of the existing templates from the databox for free. The items in the databoards are drag and drop, so you can easily arrange the databoard as per your requirement.
Reporting in marketing is so far the tedious task. This custom reporting dashboard will solve the issue while there are no free options on datastudio.
Is there anyway that we can integrate with Datastudio for free?
This is valuable post and creating an dashboard will be useful for both the client and for us.