Learn how to create an insightful Facebook Ads report that will help you and your clients save time. This technique will not only be useful for freelancers but also for small business owners and if you are working in an agency handling multiple clients.
We will see two ways to create a Facebook ads report in the blog post.
Facebook Advertising:
More than 2.9 billion people use Facebook and no doubt that Facebook is the biggest social network worldwide. No matter who your audience is with any age, gender, or occupation, you’ll be sure to reach them through Facebook Ads.
And you will be targeting the audience on both Facebook as well as Instagram using Facebook advertising.
Facebook ads are one of the most effective marketing platforms, especially for B2C. Even small e-commerce businesses use Facebook advertising to reach the target audience.
Any advertising needs proper reporting for making it one of the successful platforms to optimize further. But reporting is considered as one of the tedious jobs in marketing.
Facebook Ads Reporting:
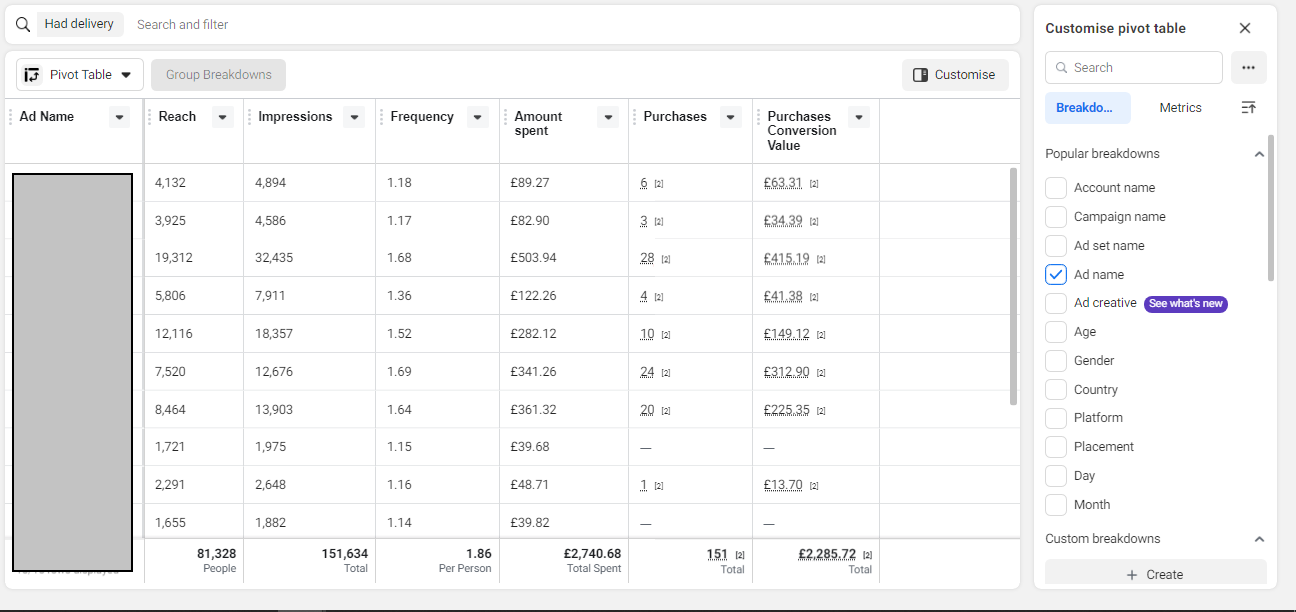
Facebook ads manager does provide a free option to create an advertising report. It helps you send you the send the performance report weekly and monthly.
The reports can be customized with breakdowns by account, campaign, ad set, Ad level, and much more. You can also create custom breakdowns if you need one. And you can include the metrics that matter the most for your business.

You can then save the format so that you can reuse it at any point in time. You can also share the link to the report right from the Facebook ads reporting dashboard.
So that they could able to view the data in real-time and along with the date filter the clients with the link can view the performance by day, weekly, and monthly wise.

But the problem with the report from Facebook is, that it’s not visually appealing. If you are sending it to a client they might expect a professional report rather than just rows and columns.
Even though the report serves the purpose, custom reporting is impossible with facebook’s inbuilt ads report.
While you can use data studio to create an outstanding report by copying and pasting the downloaded data on google sheets and then connecting them to the data studio.
But the data won’t be real-time. And it will become very tedious the ever as you need to keep updating the data on the sheets regularly.
And data studio doesn’t have the free Facebook ads connector. So we are not getting free help from data studio either.
Facebook + Databox:
Databox is more similar and considered as an alternative to data studio. It allows you to create Facebook ads reporting dashboard. So what is databox?
Databox is a business analytics platform built to help you understand what’s going on with your business. It’s been ranked as the number 1 most usable data visualization tool by G2 Crowd.
Rather than static reporting, the report created using Databox is dynamic. You can share the link of the live databoards (dashboards) to the clients where they can view the data in real-time at any point in time. This will also save your time for spending reporting each and every week and month.
In short, it’s a live dashboard that provides you with important metrics which help you to measure business goals. It integrates with more than 70+ platforms including HubSpot, Facebook pages, Facebook ads, Linkedin ads, etc. And with 2000+ third-party integrations. And it also supports Zapier and Integromat.
Let’s see how to create a stunning Facebook ads report/dashboard using databox.
How to create a Facebook Advertising report using Databox?
With Databox you can create amazing reports that provide important metrics which help you optimize the campaigns swiftly.
- Visit Databox and create a free account. The forever free account provides 3 datasources connections with 3 dashboards which is more than sufficient to create facebook ads report.

- Choose the data source as “facebook ads” and click to continue.

- Choose the metrics that are important to you but anyway this will be shown in separately in the platform and has nothing to do with your reporting. So you don’t even have to choose anything other than the default selection. Once then Click to continue.
- You can now add your facebook ad account by yourself or with a help of a teammate if you don’t have access. If you have the access, just click “connect now”. The popup will take you to the Facebook login where you have to provide permission.
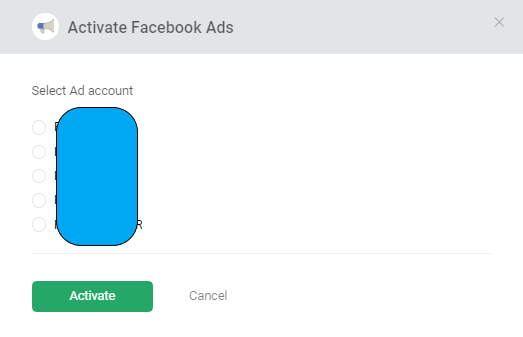
- Select the ad account that you would like to make the report and click “activate”

5. Then click databoards from the sidebar.
6. Click and create a new databoard, you can start from scratch or you can use the available templates. Let’s choose the templates, click to “use wizard”
7. Select the connected facebook ad account as a data source. And then click “Start from a template”
8. You can choose the appropriate template as per your wish. Click “use this template” and select the data source. Don’t worry if some template doesn’t have specific metrics that you need to track or report. You can add and customize as per your wish once you select the template.
9. Now click to edit and customize the dashboards as per your wish. And you can add up to three databoards in a free plan. So you can extend your report up to three databoards and loop them together.
10. That’s it. You have now created a Facebook ad report live dashboard. You can now customize, and personalize the dashboard as per the objective.
You can share the reports as a live dashboard or schedule it daily, weekly, or monthly to send a screenshot of the dashboard to your client’s email address.
They can use the date filter to view the data as per their need so that you don’t have to send them weekly or monthly reports. It makes it a lot easier even for you to track the performance of the campaign.
The purpose of the Facebook ads reports is to represent marketing insights focusing on the parameters that you and your clients have selected.
You can even connect with your analytics to make the dashboard more informative. If you subscribe to their paid plan you can even have more dashboards, connectors, custom metrics, and history of data.
Facebook Ads Reporting Template
You can create a reporting template from the scratch or you can use any of the existing templates from the databox for free. The items in the databoards are drag and drop, so you can easily arrange the databoard as per your requirement. Learn more about woocommerce custom reports
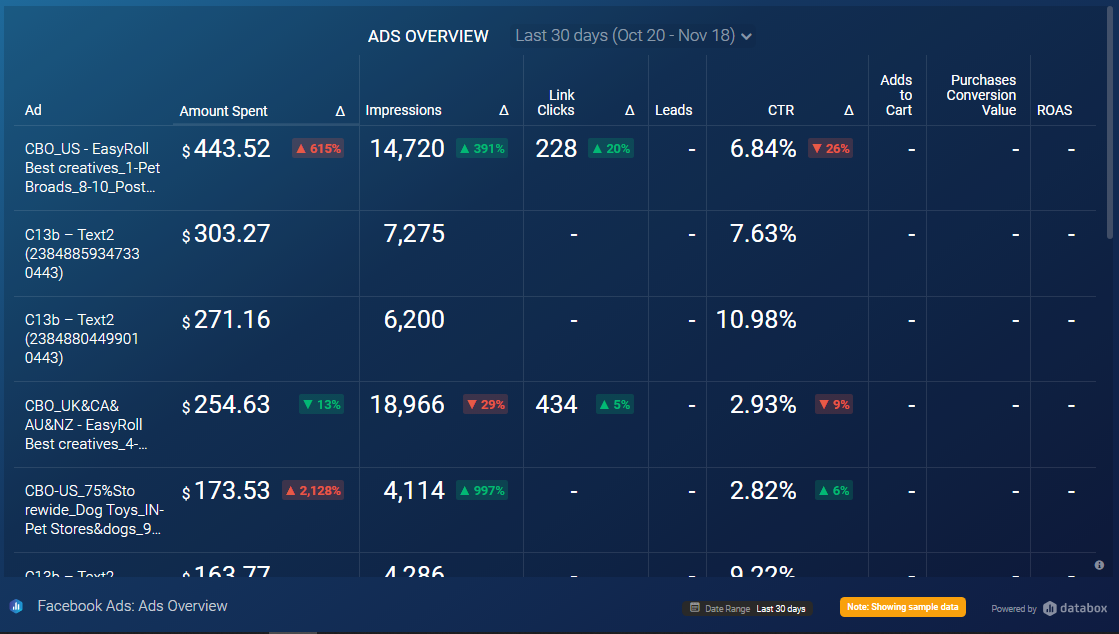
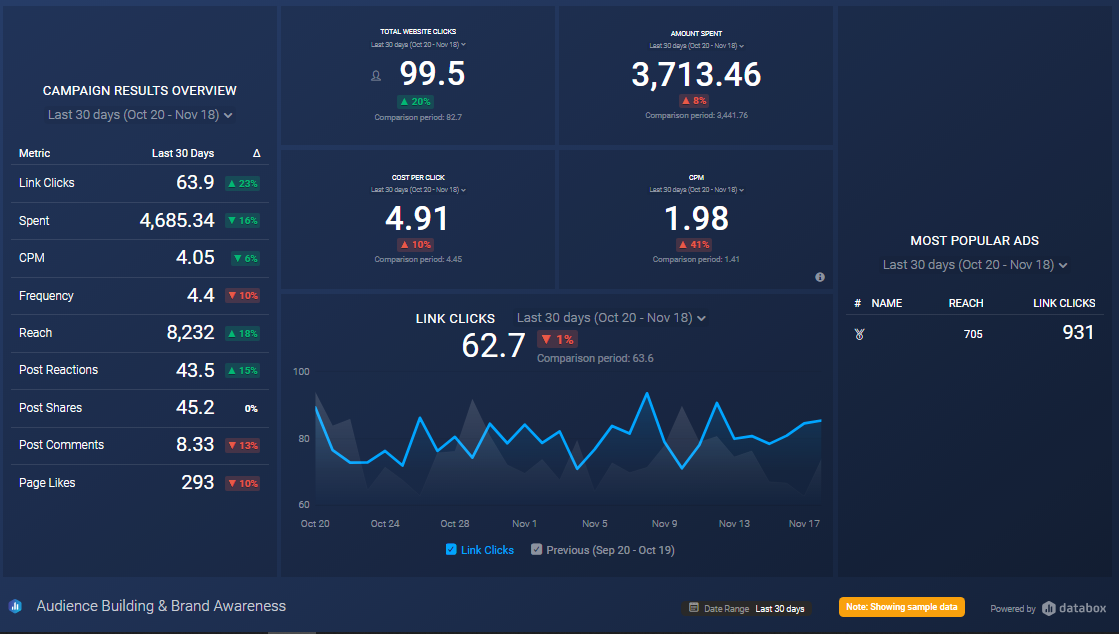
Track some of the most used Facebook Advertising metrics and KPIs and analyze your Ad performance with just a few clicks. The below templates are from the databox.
Below are a few Facebook ads reporting templates that are available on databox.


I was looking for something similar to overcome the tedious part of creating facebook reports each and every week, monthly. But this dynamic reporting dashboard will solve my problem
Thanks for the amazing thing. I always wanted this and was using supermetrics with data studio but this is outstanding.
This is amazing. I’m a freelancer and I use sheets to deliver the reporting. But this free account is amazing for me.